Reconciliation Task
Reconciliation task compares two workbooks and highlights differences between them. The two workbooks compared are called the reference and target sources. The target source is commonly a report task providing data from the target system. The reference source can be either a static workbook with information known to be correct, or a report collecting fresh data from a reference system.
Configuring the Task
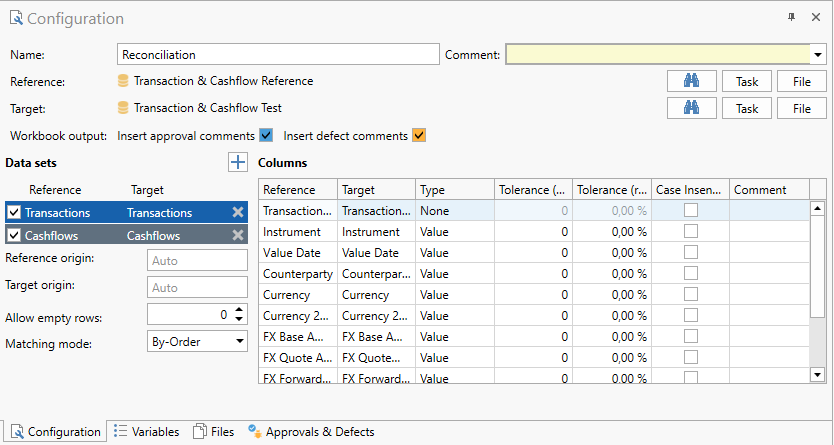
- Name: The name of the task.
- Reference: A task or collateral file providing the reference source workbook.
- Target: A task or collateral file providing the target source workbook.
- Workbook output: Allows you to enable/disable output of workbook comments for approvals and deviations. Disabling this can greatly improve performance if you have many cells affected by approvals or defects.
- Data sets: A list of worksheets from the reference and target sources.
- Columns: A list of columns in the selected data set.
As the reconciliation task identifies differences between two sources, the difference between reference and target is purely semantic. Any deviation found when executing the reconciliation task is described as a deviation in target from reference. If a number reference=100, target=101, the deviation is output as 1 (positive, target > reference). Inversely, if target is 99 the deviation is output as -1 (negative, target < reference).From a practical standpoint it is important that all reconciliations in Test Plan reflect the same relationship between reference and target to avoid confusion.
Data Sets
The Data sets configuration consists of a list of worksheets present in the reference source and a mapping to the corresponding worksheet in the target source.
When both the target and reference source has been selected, a best-guess mapping based on worksheet name is applied. The mapping is fuzzy to allow automatic mapping even when there are small differences in spelling between the reference and target sources.
You can manually change the automatic mapping expanding the drop down in the Target column of the row you want to change and select a data set from the target source. You can remove sets with the delete button in the right-hand margin. To disable as set uncheck the checkbox in the left-hand margin.
Start position
By default, the reconciliation starts in the first populated column of the first populated row of the sheet. If you are not satisfied with the automatically identified starting position you can set one manually by entering a cell address.

You can also configure the start positions in the Reference origin and Target origin input fields for the respective data sets.

Multiple sets per worksheet
If you have multiple data sets in the same worksheet you can add additional sets by clicking the add button (+) and configure it manually.

End position
By default the data set is considered to end on the first completely empty row. If your data set is expected to contain empty rows you can trim the number of empty rows that are required to identify the end of the set.

Full worksheet reconciliation
Instead of reconciling one or more data sets from a worksheet, you can reconcile the worksheet by setting the start position to '*':

In this mode the entire used range of the worksheet is reconciled, and Allow empty rows has no effect. You can configure Keys, but if the worksheet is sparsely populated it may make sense to use a simple By Order matching with no keys.
Configuring columns
The columns section shows a list of columns from the reference data set currently selected in the Data sets section:
- Reference: The column header from the reference source.
- Target: The column header from the target source.
- Type: The type or usage of the column
- Key: The values in the column are used to identify the row.
- Value: Value columns are compared between reference and target to identify differences.
- None: The values in the column are propagated to the output for reference, but are not considered in the reconciliation and have no effect on the success rate.
- Tolerance (abs.): The maximum nominal tolerance allowed when reconciling this column.
- Tolerance (rel.): The maximum relative tolerance allowed when reconciling the column.
- Case Insensitive: When checked, the column pair is compared case insensitive. This is applicable to both key and value type columns containing text data.
- Comment: A comment describing the configuration of the column.
When the data set mapping is changed (automatically or manually) an automatic best-guess matching of reference and target columns is applied. The mapping is fuzzy to allow automatic mapping even when there are small differences in spelling between the reference and target sources.
Keys
Keys act as an identifier of a record or a group of records. This identifier determines what records from reference and target should be matched; Records with different keys can never be matched.
The key can be something simple like a unique record ID like Transaction Number, or more commonly include multiple fields. Assuming a key configuration including the fields A, B, C the record set is divided into subsets based on unique combinations of values. If e.g. multiple records have the key [A=x, B=y, C=z] these are in the same subset.
Tolerances
Tolerances can be applied to value columns and determine a maximum allowed difference between reference and target to be considered a match.
There are two tolerances that can be used together or individually:
- Absolute tolerance: A maximum allowed nominal difference.
- Relative tolerance: A maximum allowed relative difference in target relative to reference.
If both relative and absolute tolerance are set (tolerance != 0) both are in effect. An observed difference must satisfy both relative and absolute tolerance limit.
If either tolerance is 0 (but not both) it is disregarded, and the other tolerance (tolerance != 0) is in effect.
A difference that falls within configured tolerance is highlighted as approved in the reconciliation output.
Relative difference is calculated as absolute difference in target from reference:
relative_diff = abs(target – reference) / abs(reference)
Matching modes
The reconciliation task supports a few different matching modes:
- By-Order
- Prefer Exact Values
- Simple Probabilistic
- Exact Matches Only
- Legacy (By-Order)
You can configure matching mode per data set. The primary difference between the different modes is how they handle matching where key configuration doesn’t uniquely identify a single record.
By-Order
If the key configuration doesn’t identify records uniquely By-Order uses the order of records as they appear in the original data set to distinguish the records for each other. Records are numbered individually per key subset of records, i.e. each key subset has their own first, second, third record etc. This means that you can sort the source sets according to one or more columns, allowing the sort columns to assist in identifying records without making them keys.
By-Order is the preferred matching mode if you either have keys that identifies records uniquely or if you have a combination of column you can sort on to add identity. By-Order is fast and works well on larger volumes, as it always identifies 1:1 record matches.
Prefer Exact Values
Prefer Exact Values is a best-match mode, meaning if the key configuration doesn’t identify records uniquely it will compare all reference records in a key subset with all target records in the corresponding subset to find the best possible match.
Briefly, the algorithm works as follows:
- Apply any manually matched records and records approved as missing.
- Group the source sets by keys into key subsets.
- For each key subset:
- Identify any exact matches and define them as matched.
- Compare each remaining record from the reference subset to each record from the target subset.
- Calculate a matching score for all value cells of the record pair.
- Select the best scoring matches until all records from either the reference sub set of the target sub set is empty and define them as matched.
- If any records remain in the reference or target subsets, define them as unmatched.
The scoring algorithm used is highly biased toward exact matches. A value that matches exactly (independent of data type) gives a score of 1. A non-match of discrete values (strings, dates etc.) gives a score of 0. Non-exact matches of numeric values are given a normalized score 0 < score < 1 describing how close the numeric value match is. The total matching score is calculated as count(exact matches) + average(non-exact scores). Because non-matches and non-exact matches are grouped and averaged separately, this component of the score can never exceed 1, and thus never overpower a value that matches exactly.
When Prefer Exact Values is selected as matching mode you can also define a threshold for the maximum number of errors/non-exact values that are allowed in a match.

This allows the algorithm to stop processing a potential match very early in the process, as soon as allowed errors +1 is encountered, which is a sizable performance gain when the key configuration identifies large record subsets. In addition, you can trim this value to move low-scoring matches into the unmatched sets if you prefer to match them manually instead.
The Prefer Exact Values matching mode is very effective at identifying the best possible match even on large sets and with poor quality data with many errors. It is preferred whenever the column structure of the source data sets doesn’t allow keys to be configured to identify records uniquely.
Simple Probabilistic
Simple Probabilistic is a best-match matching mode like Prefer Exact Values. The key difference between the two is that Simple Probabilistic uses a statistical approach to calculate matching scores and that it strongly dislikes numbers of different signs.
Briefly the algorithm works similar to Prefer Exact Values:
- Apply any manually matched records and records approved as missing.
- Group the source sets by keys into key subsets
- For each key subset:
- Identify any exact matches and define them as matched.
- Compare each remaining record from the reference subset to each record from the target subset.
- Calculate a matching score for all value cells of the record pair.
- Select the best scoring matches until all records from either the reference subset of the target sub set is empty and define them as matched.
- If any records remain in the reference or target subsets, define them as unmatched.
The scoring algorithm of Simple Probabilistic is similar to Prefer Exact Values but assigns a weight to each matching/mismatching cell representing the identity value of that cell. The identity value is calculated statistically based on how frequent that specific value is. E.g. if two payment records match in a value Currency=’EUR’ and EUR payments makes up 80% of the data set the identity value of EUR=EUR is very low. In fact, picking a random record from each of the reference and target subsets it is more likely that both records are EUR payments than that one of them is not.
Inversely, if two payments match in the value Currency=’SEK’ and there is only one SEK payment each in the reference/target subsets respectively the identity value of SEK=SEK is extremely high.
Numeric values are normalized and compared. However, numbers with different signs generates a negative score. This means that the identity value of a number is more dependent on the sign than the actual numeric value itself.
Unlike Prefer Exact Values, Simple Probabilistic doesn’t have a configurable error threshold. Instead, a negative score is assigned to mismatching values, weighted by identity value. If the total matching score is <0 the match ignored and deferred from further processing.
Simple Probabilistic is an alternative to Prefer Exact Values that can theoretically create better matches and requires very little configuration. However, the performance of the algorithm is highly dependent on the size of the subsets of records identified by keys. For example, if a key identifies 1000 records from each of the reference and target sets, with a value column count of 10, 10’000’000 weighted record scores are calculated for that subset alone. If you can add another key column and get the subsets down to 50*50 this greatly improves performance.
Exact Matches Only
The Exact Matches Only matching mode is true to its name; It matches only records that are exactly equal in every value (discounting columns that are configured with role ‘None’). All other records are left unmatched. This algorithm is the performance optimization of the best-match modes packaged into a separate matching mode, and as such it is very fast on high volumes. It is particularly useful if you have large data sets that you expect to match exactly or very well. Exact Matches Only allows you to prove or disprove it quickly.
Legacy (By-Order)
Selecting this matching mode lets you revert to the matching logic that was used before OmniFi v6.8, of which By-Order is a re-implementation. Legacy is provided for comparison only and is not maintained or developed further.
Reconciling CSV files
The reconciliation task allows you to reconcile CSV files, which can be useful to run regression testing on for example interfaces. To reconcile two CSV files, add both files to Files and select them as Reference and Target source respectively.
The file extension .csv is important, as it instructs OmniFi to read a CSV file. For example, a .txt file is instead interpreted as TAB -separated file.
You don't have to configure the CSV list separator, it is auto-detected individually for each file.
Data points from CSV files sources are always read as text data. It is possible to reconcile a CSV file and a workbook, but becasue Excel attempts to interpret text values as other data types (numbers, dates etc.), you may need to format all Excel cells as text manually before attempting the reconciliation.
Updated about 1 year ago