Test Results
In Autotest, the result of an operation is expressed as a percentage defining the fraction of the operation that was successful, named Success Rate. Success Rate is generated by each task as they are executed and aggregated on each group level to form an aggregated success rate.
Please refer to Executing the Test Plan for more details on execution and Success Rate.
While all tasks generate Success Rate, the final reconciliation task of a test case is usually regarded the result of the test case. The reconciliation identifies any deviations between two workbooks (usually generated by report tasks) and lets you work with approvals and defects to document and handle these deviations.
There are a couple of ways to view reconciliation output:
Reconciliation Results
The result of the reconciliation is accessible from the Logs view when the reconciliation task is selected in Test Plan or Repository. It is also possible to look at reconciliation results on a Group level Grouped Reconciliation Results

Reconciliation provides three types of results:
- Word File containing technical log of execution
- Excel file containing a static version of the regression results (used for archiving purposes)
- Reconciliation format
Use the icons in the Results column to open the different types of results.
Reconciliation Result view
The reconciliation output format allows interactive browsing of the reconciliation result, as well as creating and applying approvals.
When a reconciliation output has been generated, it cannot be changed. Applying or creating new approvals, manually matching rows etc. will have a visual preview effect in the current view, but the changes don’t permanently affect existing reconciliation output. New approvals created will only be effective the next time the reconciliation is executed.
Summary
The summary section shows a total summary for all reconciled data sets. You can view statistics per total data points compared and statistics per total rows compared.
The Formats button in the top-right corner allows you to configure how the data should be displayed for the result board.
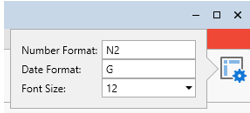
The format specifiers used are standard Microsoft format specifiers, documented for example here:Standard Numeric Format:
https://msdn.microsoft.com/en-us/library/dwhawy9kStandard Date and Time Format:
https://msdn.microsoft.com/en-us/library/az4se3k1
Data sets
The various data sets (worksheets) of a reconciliation are shown separately. You can select which data set to show by activating the appropriate tab in the tab control.
Statistics
The statistics section shows statistics per data point and row of the currently selected data set.
Drilldown
The filter section is used to determine how the details grid is organized.
Systematic deviations
Systematic deviations display systematic deviations per column, with information on count of occurrences and number of treated occurrences, in a compact format.
Numeric deviations are aggregated to a single maximum deviation per column. Static deviations (differences in text) are shown individually.

The Systematic deviations table can be used to filter the Matched view. Activate the Selected Error toggle button or double-click on a row in the Systematic deviations table to enable filtering mode. As you change selection in the Systematic deviations table, the Matched view will display the matched records that has any of the selected deviations.
You can also create approvals and defects directly from the Systematic deviations view. Select the deviations you want to approve, right-click on them and select Create Approval or Create Defect.
Button panel
The Rows toggle buttons are used to show or hide rows with specific statuses. By default, only rows with deviations are shown, but you can easily show approved or successfully reconciled rows by activating the corresponding toggle button.
The Columns toggle buttons are used to show or hide columns with specific statuses. By default, only key columns and columns with deviations are shown, but you can easily show approved or fully successful columns by activating the corresponding button.
The Values toggle buttons are used to define how the content of the grid cells are displayed. You can show or hide the reference value, the target value the deviation. When showing deviation, you can chose whether to show it as relative or nominal deviation.
The Match Type toggle buttons are used to show or hide matches that were made in specific ways. You may for instance want to show only matches that has been made manually.
Unmatching rows
Right-clicking the Matched column and selecting Unmatch row will break a match and return it’s components to the Unmatched Reference and Unmatched Target view respectively.
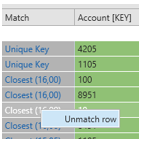
The records are unmatched transiently to allow you to create a manual match or to approve the records as unmatched, however if you don’t apply any approval the records will be automatically matched again the next time you run the reconciliation.
This option is available only for automatically matched rows. For manual matches remove the corresponding approval instead.
Unmatched rows
The unmatched rows section shows unmatched rows from reference and target.
Rows can be unmatched if:
- The number of rows on each side is not equal.
- If there is a mismatch in keys. In this case there will be an equal number of rows unmatched in both reference and target.
Handling deviations
There are two built-in ways of handling deviations: Defects and Approvals.
Defects are documentation of encountered deviations, and when the reconciliation is re-executed deviations covered by defects are shown separately in statistics and shown in yellow instead of red in the details sections to visually separate handled deviations from unhandled.
Approvals are very similar to Defects, but they mean that you are approving the deviation as an expected error, and there for they don’t count as errors towards success rate. Approvals are shown in blue.
Unless you are positive that a deviation is expected and acceptable you should register a Defect. Defects can be converted to approvals in the Approvals and Defects view.
You can create defects and approvals from a specific deviation in the Systematic deviations table:

You can also create defects and approvals directly from deviations by right-clicking the deviation cell in the Matched view and selecting either Create Defect or Create Approval and selecting one of the options.
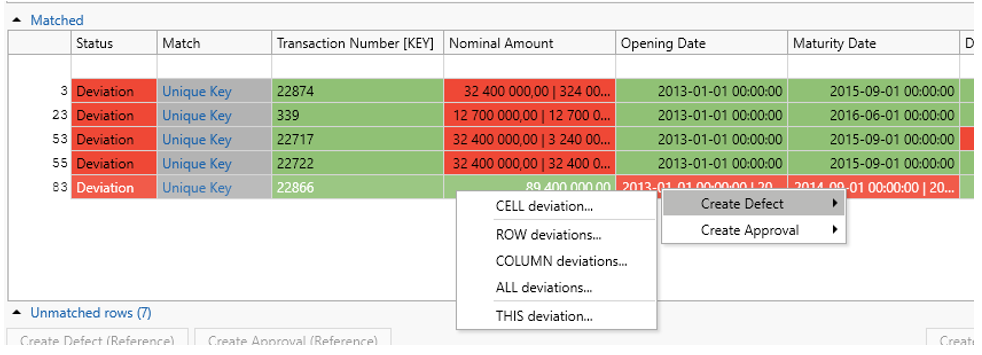
Deviation Creation Type | Description |
|---|---|
CELL deviation | Selects the deviation in the cell. |
ROW deviations | Selects all deviations in the row. |
COLUMN deviations | Selects all deviations in the column. |
ALL deviations | Selects all deviations in the data set. |
THIS deviation | Selects all occurrences of this specific deviation in the data set. |
Clicking for example Create Approval -> CELL deviation… will display the Create Approvals dialog.

Use the checkboxes in the Static, Absolute, Relative column headers to select what type of approval to create.
- Absolute: Approve a maximum difference in nominal value.
- Relative: Approve a maximum difference relative to the reference value.
- Static: Approve an exact replacement value. (This is used to approve exact differences (A/B) instead of a margin of error (±1). It is also the only way to approve differences in text values).
As with tolerances, absolute and relative approval works together if both are set. If either the absolute or relative approval component is 0, that component is ignored.Static approval is evaluated independently; A difference is approved if either
static OR absolute AND relativeare satisfied.
If you are not satisfied with the suggested approval values you can set them manually. You can also provide a comment, describing why you have approved the deviation.
Click the OK button to save the approval.
Covering multiple rows with one Defect or Approval
Approvals and defects can be for one specific row or for a set of rows. This is configured by setting the key columns that must match for the approval to be applicable. By excluding keys it will match any row that has the same value for the remaining keys
In the example below “ALL deviation…” is used and it shows eight deviations. With all keys included, eight approvals are needed to approve them.

Approvals when all keys are included
By excluding keys the approvals the approvals are less specific and are aggregated.
Include Order
“Include Order” can also be set for the key. This is only relevant if the key is non-exclusive, in which case the order is added to the key making it possible to approve one specific row when other rows have the same key. By excluding this it would match any row with the specific key.
“Include Order” cannot be set if a key is excluded.
Static Numbers
The Static Numbers option is enabled by default and causes numeric deviations to be handled with static approval values.
The difference 1000 <> 2000 expressed as a static deviation means: Reference value = 1000 AND Target value = 2000. Instead expressed as an Absolute numeric deviation means diff(Reference value, Target_value) < 1000, which includes also e.g. the deviation 500 <> 600. Static deviations are much more specific, and is therefore used by default, but you can use numeric deviations by disabling the Static Numbers option.
Classifying missing rows

You can create an approval or defect by selecting the an unmatched rows using the checkboxes and clicking on the button Create Defect/approval. The rows will be moved to the detailed section as handled.
Approvals will appear in the Defects & Approvals View:

Manually matching rows
A key mismatch yields an unmatched row in both reference and target. You can manually match rows by selecting a row from reference and target respectively and clicking the button Manually match rows. This will add a key mapping, forcing the two rows to be matched. Value cells of manually matched rows are compared during reconciliation, allowing nominal differences to be identified also for manually matched rows.
Grouped Reconciliation Results
You can also view reconciliation results aggregated on a group level. This is useful to identify systematic errors, and to manage results of multiple reconciliations that are very similar.
Group results can be viewed by right-clicking the group you want to view the results for.
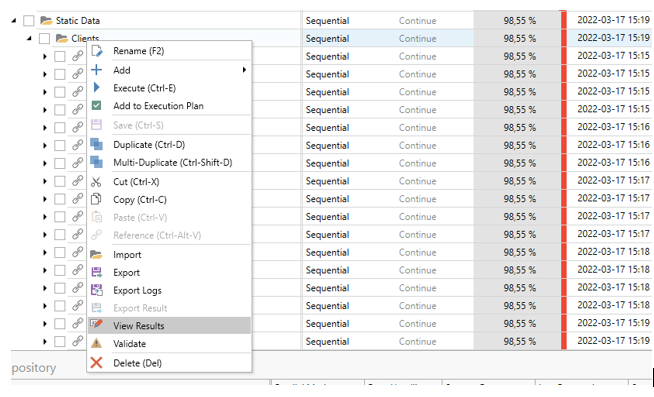
You can also select the node in the Test Plan and click the view results button in the Log View.

The Show Group Results dialog will appear.
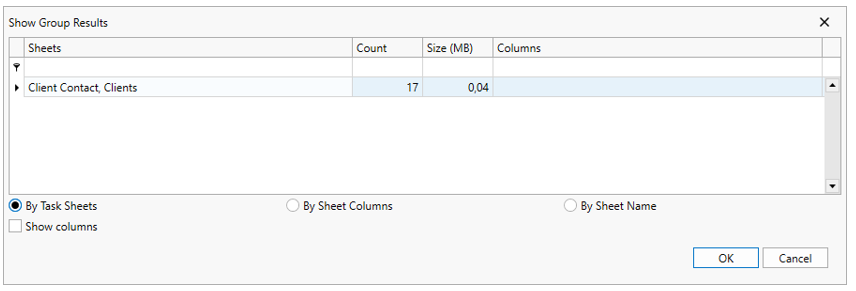
The Show Group Results view will display one or more rows of related sheets. To show the results, select one or more rows and click OK.
The rows shown are a combination of sheet archetypes and task archetypes calculated from all reconciliation tasks in the selected branch. The sheet archetype depends on the column names and roles. The task archetype depends on what sheet archetypes the reconciliation task contains, and their enabled/disabled status.
Group results can operate in three different modes that affect how the sheet and task archetypes are used, and consequently how sheets are grouped together: By Task Sheets, By Sheet Columns, By Sheet Name.
By Task Sheets
In the default mode, results from task archetype are grouped together. That is, results from reconciliation tasks containing the exact same sheets, in turn containing the exact same columns are grouped together.
This means that you may have the same sheet name listed on multiple rows, and even the same combination of sheet names listed on different rows due to differences in column configuration.

In this example the sheet Clients is shown on two rows because 17 reconciliations have Clients and Client Contact, whereas one reconciliation has only Clients.
If you select multiple rows, tabs will be generated to represent each of the unique sheets. If, for example, the name “Clients” occur on two selected rows, two tabs named Client will be shown in the reconciliation output board.

This mode is useful to view results of many references to the same test case, and each row in the Show Group Results view can be seen as different reconciliation archetypes, so you can use it on a root group level that would contain vastly different archetypes and still get a coherent result.
By Sheet Columns
In this alternative mode, the task archetype is not used. Instead, sheets with the same column configuration are grouped together by sheet archetype only, regardless of what other sheets are in the same task.
You may have the same column name listed on multiple rows if they have different column configurations, but because the task archetype is ignored, this mode is more effective at finding output sheets that describe the same data.

In the same Client reconciliation scenario, Clients is now only listed on one row, because for all 18 reconciliations, the Clients sheet has the exact same configuration.
This mode is useful in cases where you have multiple different reconciliation configurations that describe share common sheets. Reconciling migrated transactions, you may have different reconciliations for different instrument types, but for example the cashflow fields reconciled are the exact same. In this case you can view the Cashflow reconciliation result grouped together instead of separately per instrument type. Because this mode decouples the sheets from the tasks, it also enables you to look at unrelated sheets as one unit. You can for example open Transactions and Instrument setup together, which can aid when trying to identify the root cause of a deviation.
By Sheet Name
In this mode both the task and sheet archetypes are ignored. Instead, the sheets are grouped together based on name only. Two sheets with the same name but different columns are shown in a single tab in the reconciliation result view, with all the columns from both sheets.
If you in the By Sheet Columns mode get the same sheet on multiple rows it’s because they have different column configurations:

By setting the mode to By Sheet Name, you can force the sheets to merge by name:

The result view will show all columns from both reconciliations:
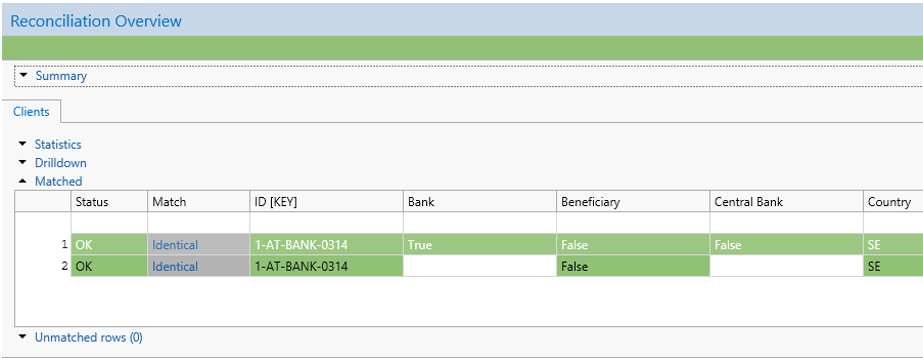
This mode is useful in the previous deal reconciliation example, as it allows you to view the Transaction level grouped together, even though different instrument types are reconciled with different columns.
Updated 9 months ago