Treasury Monitor
The Treasury Monitor data source is used to extract data from either predefined treasury monitor books or to create custom ones.
To create a new Treasury Monitor Query in the Query Configuration Wizard, follow these steps:
Step 1: Select Query Type
Select the Treasury Monitor query type from the list of data sources and optionally specify a name and output destination in the the top half of the Options page.
If you already have a Treasury Monitor Book (the exportable XML definition) then you can select the XML view variant instead.
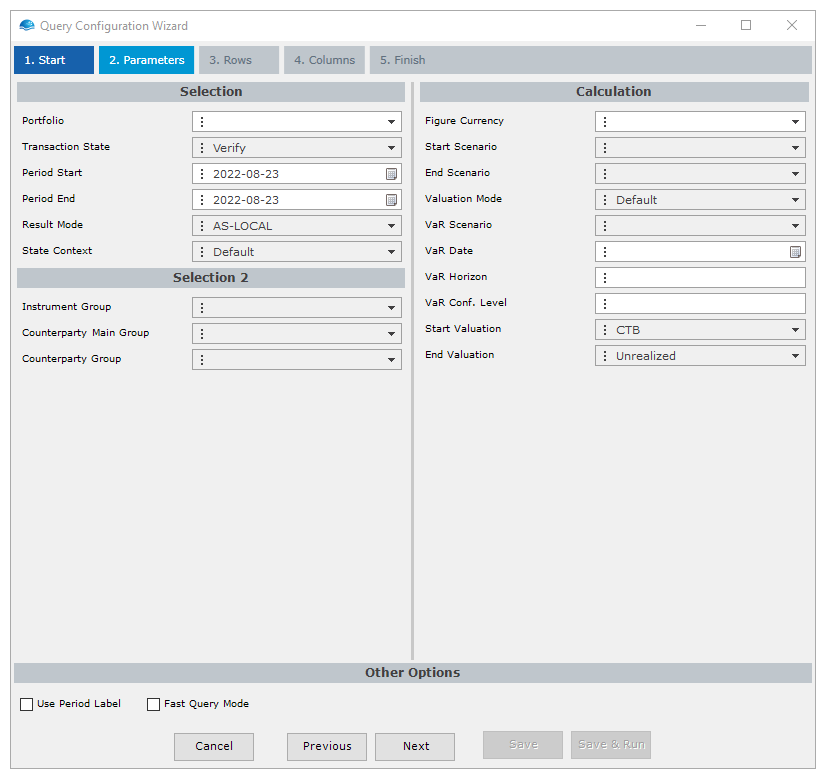
Step 2: Configure Query Parameters
The following dialogue contains the same parameters as the Selection and Calculation tabs in Treasury Monitor’s Position Parameters window. Enter the appropriate parameters.
If already have a predefined XML Book then skip to the XML View, otherwise press next and configure the rows & columns to be queried.

Parameter Selection Window
Other OptionsThere are two optional checkboxes available under the 'Other Options' that handle advanced behavior of the query type.
Use Period LabelAt the bottom of the window is an option to Use Period Label. Tick the box if the query includes columns including periods or gap sets. This ensures that their labels are displayed in standard format (1M, 2M, 1Y, 10Y, etc.). If left unticked, OmniFi might display the periods or gap sets in a different format.
Fast Query ModeEnable this to use a faster query method that returns the entire result all at once. The default query will read values row by row. This method is faster, but since it gets all data in one request it may fail due to higher memory consumption.
If you experience problems with Fast Query Mode, please ask your system administrator to increase the maximum allowed message size in in the ORB configuration.
Step 3: Selecting Rows
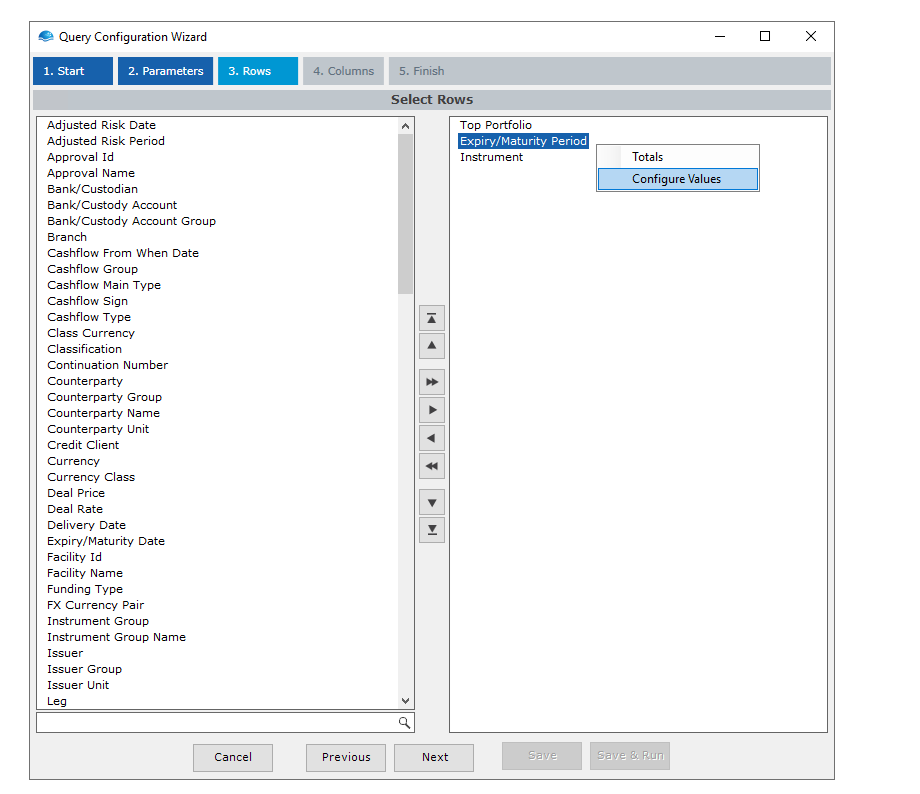
Select which rows to include in the query, the row definition determines how data will be grouped in the Treasury Monitor Query.
Some rows also contain additional possibility for customizations, similarly to how they behave in the Treasury Monitor (e.g. Risk Period). Once selected you can right-click on the selected row and select 'Configure Values' to define for example what Gap Set to use.

Selecting Rows for Grouping
Step 4: Select Output Columns
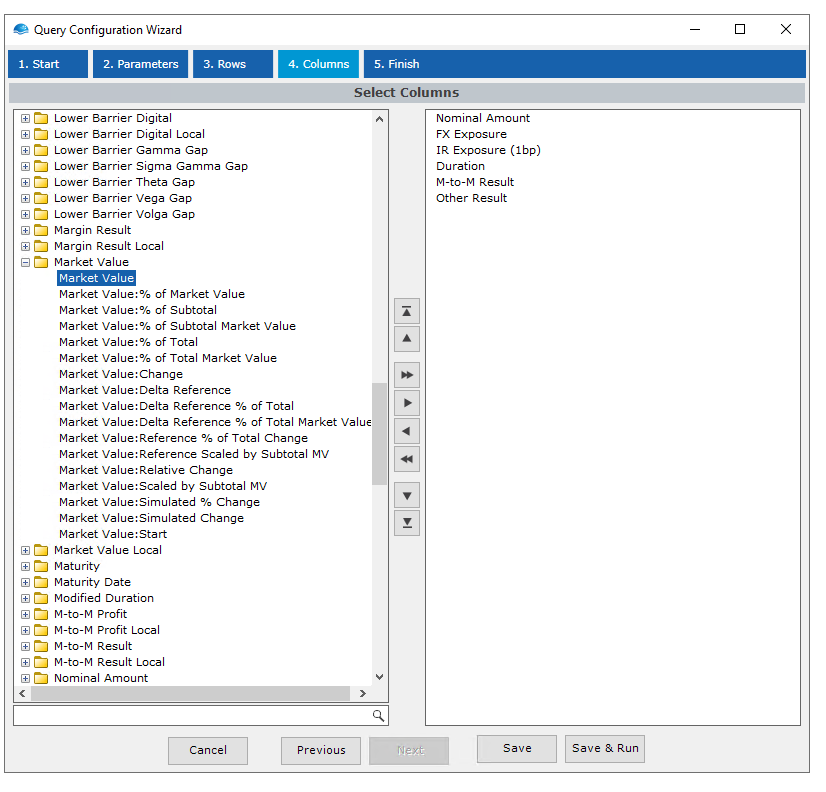
In the final step, select which key figures to include in the query. Each folder contains both the "Standard" Key Figure as well as all the "Special" ones (e.g. Market Value: % of Total).

Selecting Output Columns
Step 5: Finalizing the Query
Choose Save to save the query without running it, or Save & Run to save and execute the query. If query output is defined then you will see your output in Excel.
XML Views
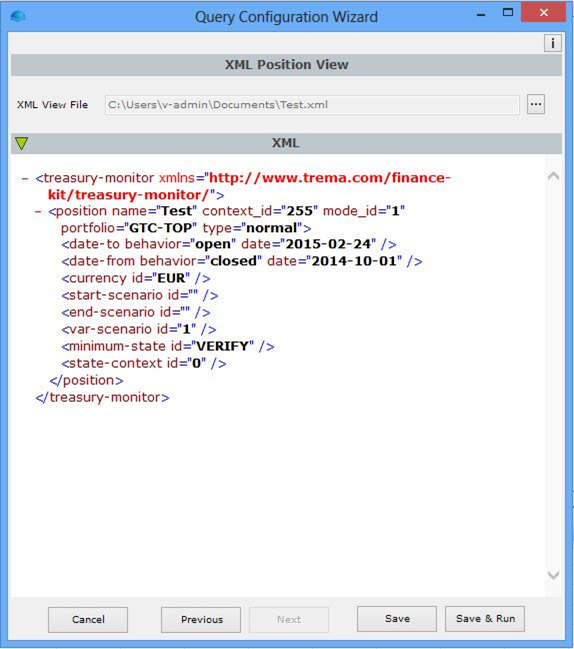
If using an XML view, then the rows & output columns are defined by the layout. Instead of selecting these fields during the query creation, the user specifies which exported XML book to use.

XML Book definition
Updated 9 months ago