Report Modifiers
Report Modifiers
Modifiers are a range of functions that can be used to transform data in the Report. Applied modifiers are displayed in the Modifier Stack and the available modifiers are found in the Modifier List (see Creating Reports for reference)
OmniFi supports a range of modifiers that enable transformation of the datasets:
| Modifier | Description |
|---|---|
| Column | Adds a new column to the dataset where calculations can be performed |
Merges two datasets together vertically (adding rows) | |
Removes duplicate rows | |
Filters out rows that matches a specific criteria | |
Pivots data and groups it | |
Merges two datasets together horizontally (adding columns) based on one or more keys. | |
Merges two datasets together horizontally (adding columns) based on one or more keys. | |
Sorts rows | |
Transposes report output |
Adding Modifiers
To add a modifier to the report, either drag & drop the modifier from the List to the Stack, double-click the on the modifier, or click on the + next to the modifier. Removing an applied modifier can be done by pressing the x.
Editing Modifiers
Once a modifier is added, it often needs to be configured. The configuration window, which differs depending of the modifier, can be opened by either double-clicking on the modifier or clicking the pen-icon.
Column
The Column modifier is used to add a new column to the report. What the column contains will have to be configured using the modifier configuration window called the Formula Editor.
Formula Editor
The Formula Editor has several sections:
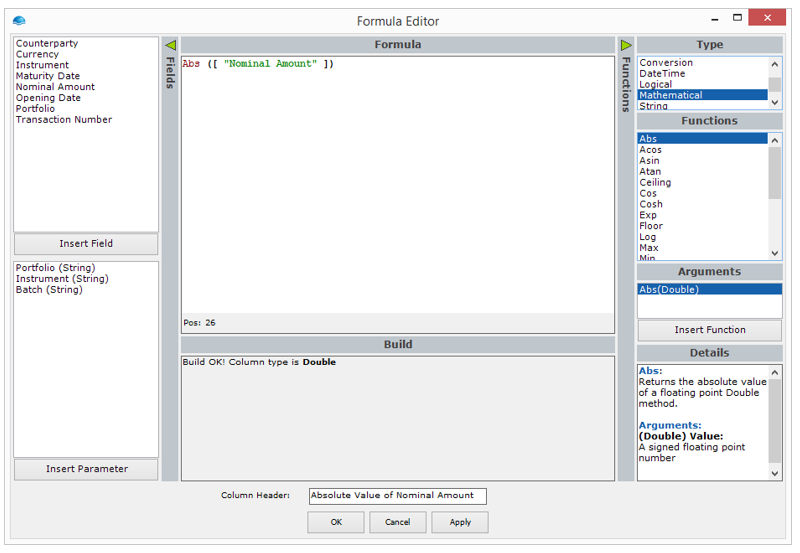
Column Modifier - Formula Editor
- Fields (top left) lists all available fields that can be used in the formula. This list consists of already existing columns in the report. Insert a field either by double-clicking, or selecting and clicking Insert Field. Note that fields are referenced between quotes and square brackets
[ "Field Name" ]as shown in the screenshot below. - Formula is where the formula defining the column is written. The screenshots below show examples of this. As illustrated by the first figure above, you can also comment on formula by using the comment marks
/* comment */.


- Parameter values can be part of the formula. and they can be added by selecting a parameter in the bottom left panel. A parameter is a referenced by the name of the parameter delimited by the '$' sign.
The parameter that is used in a formula must have a unique name.

- Column Header allows you to enter the header for the new column. Note that you cannot enter a column header that already exists. Column headers must be unique.
Functions
- Type lists the different function types.
- Functions lists the functions depending on which Type is chosen. Insert a function either by double-clicking, or selecting and clicking Insert Function. The inserted function will show where to add the appropriate arguments to the expression.
- Arguments shows the different sets of arguments that can be used in the function.
- Details shows basic information about the function.
Data Types
There are six basic data types supported by the Column modifier:
- Int32 (32-bit integer numbers)
- Double (64-bit real numbers)
- String (Text)
- Boolean (True or False)
- DateTime
- List
The data type of a new column is determined by the formula entered. It is not possible to construct formulae that return different types of data even if using conditional statements. For example, it is not possible to have a formula that returns a string if a condition is met, and a double if not.
If two different data types are used in a formula, OmniFi will try to convert them automatically. The automatic conversion is only available when a data type can be altered without loss of definition. For example, an Int32 can be made into a Double, but not vice versa since that would mean the decimals would be lost.
Alternatively, you can also convert between data types explicitly by using the conversion functions in the Conversion function group.
Operators
The Formula Editor supports a number of basic operators, including addition, subtraction, division, and multiplication. Comparison and Boolean operators are also supported as shown in the tables below.
| Arithmetic Operators | Data Types Supported | |
|---|---|---|
| Subtract | * | Double, Int32, List |
| Add | * | Double, Int32, String, List |
| Multiply | * | Double, Int32 |
| Divide | / | Double, Int32 |
| Comparison Operators | ||
| Equals | = | Boolean, DateTime, Double, Int32, String |
| Differs from | <> or != | Boolean, DateTime, Double, Int32, String |
| Less than | < | Boolean, DateTime, Double, Int32, String |
| Less than or equals | <= | Boolean, DateTime, Double, Int32, String |
| Greater than | > | Boolean, DateTime, Double, Int32, String |
| Greater than or equals | >= | Boolean, DateTime, Double, Int32, String |
| Boolean Operators | ||
| Or | | | Boolean |
| And | & | Boolean |
Working with lists
Certain fields such as Cashflow Attributes are lists of elements. You can work with these using a number of list operators, including inserting new elements, finding elements, checking for existence of an element and more.
The element type of a list is always a generic object, so you need to ensure that you know what the actual element type is. Cashflow Attributes are lists of String, so you can use string operations on the elements, e.g
substring(elementat([ "Attributes" ], 1), 0, 2)Applying the above expression on a list of numbers would yield unexpected results.
In addition you can declare a new list using the function List(). To populate the list you can either use the Append() or Insert() functions, or you can use the + operator:
To remove elements from the list you can use the - (minus) operator:
[ "Attributes" ] - "Nominal Amount".The above expression will remove the element "Nominal Amount", if present.
Checking your formula
You can check your formula by clicking the Apply button in the Formula Editor. You will then be able to see the build results and error information in the Build section. For example, for a simple formula [ "Nominal Amount" ] * 3 the Build shows
Build OK! Column type is **Double**
Notice that the column type produced by this formula is a Double, even though the two inputs in the formula are Double (Nominal Value) and Int32 (3). This demonstrates that an automatic conversion has been made. On the other hand, for the flawed formula ([ "Nominal Amount" ] - 100 * 3 the Build shows
UFactor: Unmatched opening parenthesis @0
In this case, an opening parenthesis was found but not any matching closing parenthesis, and so the Build shows an error.
By using the Apply button, you can modify the configuration without closing the Formula Editor window.
Concatenate
The Concatenate modifier is used to combine two datasets of similar column structure by adding the rows of the concatenated data to those of the base data.
Configuring the modifier begins in the Configure Concatenation window where you select which data to concatenate through the Select dataset button. This launches a new window where you can either choose to create a new query by selecting <Create New Query ..>, or choose an existing dataset from a saved query or another report.
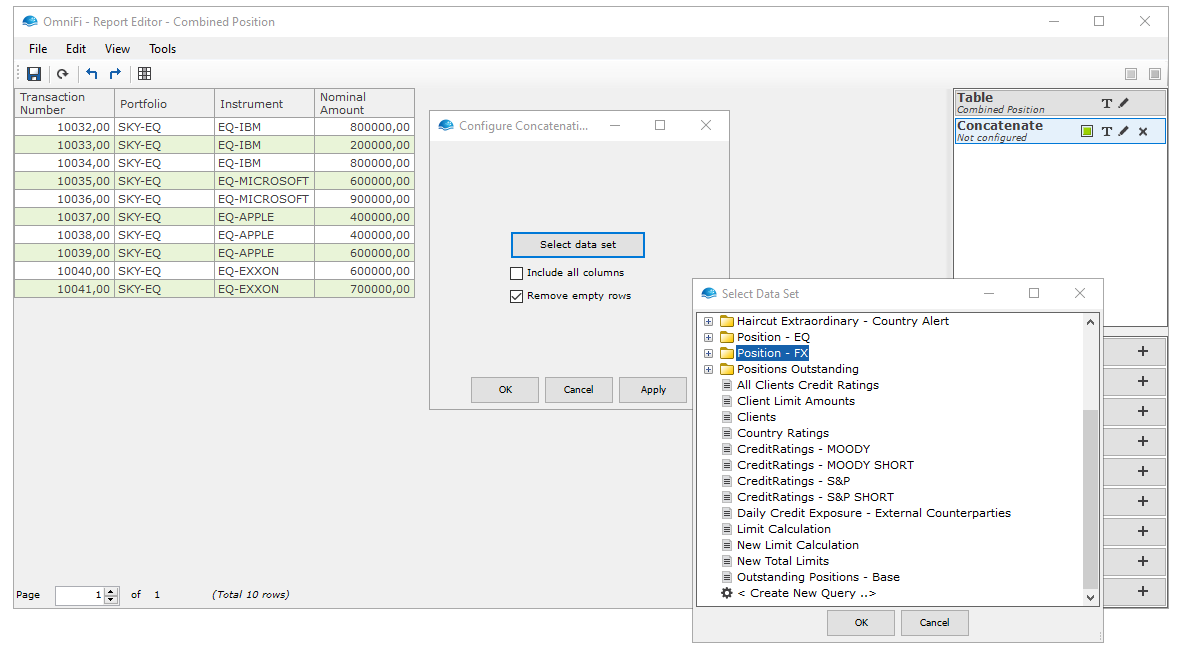
Configuring the concatenate modifier
The Configure Concatenation window has two additional options for the modifier:
- Include all columns is a switch that allows you to choose whether to display columns from the concatenated data that do not have corresponding columns in the base data. Note that columns from the concatenated data that have corresponding columns in the base data are always included.
- Remove empty rows is a switch that removes all the empty rows in the concatenated data before adding it to the report.
Note that in order for the concatenation to work, the chosen data to concatenate must have the same column structure as the base data with matching Column Headers and data types.
Once the data to be concatenated has been chosen, the results will be shown in the Preview Area of the Report Editor.
Example
The figure below shows an example of how concatenation works for two Transaction Board queries on different portfolios. The base data was for Portfolio = SKY-EQ while the concatenated data was for Portfolio = SKY-FX.
The two datasets were originally two separate reports

Sample datasets to concatenate
After the concatenation modifier has been applied and configured then the merged datasets looks like this
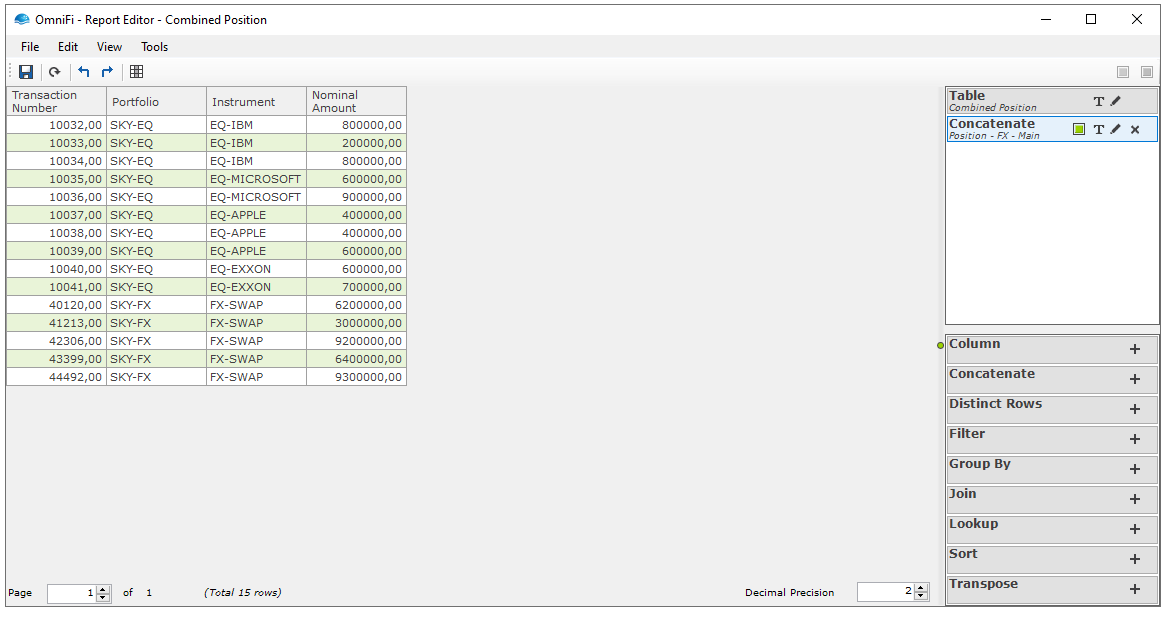
Result after concatenation
Distinct Rows
The Distinct Rows modifier is used to remove duplicated rows in a report. The configuration is made in the Configure Distinct Rows window, where you can select which column/s are to be distinct, whether to use the first or last row, and how many number of rows to display.
Choosing Columns
When configuring the modifier, one or more columns may be chosen to show distinct combination of values.
The following figures build upon the concatenated result in Creating Reports . The first one shows the effect of Distinct Rows when only the column Portfolio is chosen, while the second shows the effect when both Portfolio and Instrument are chosen.
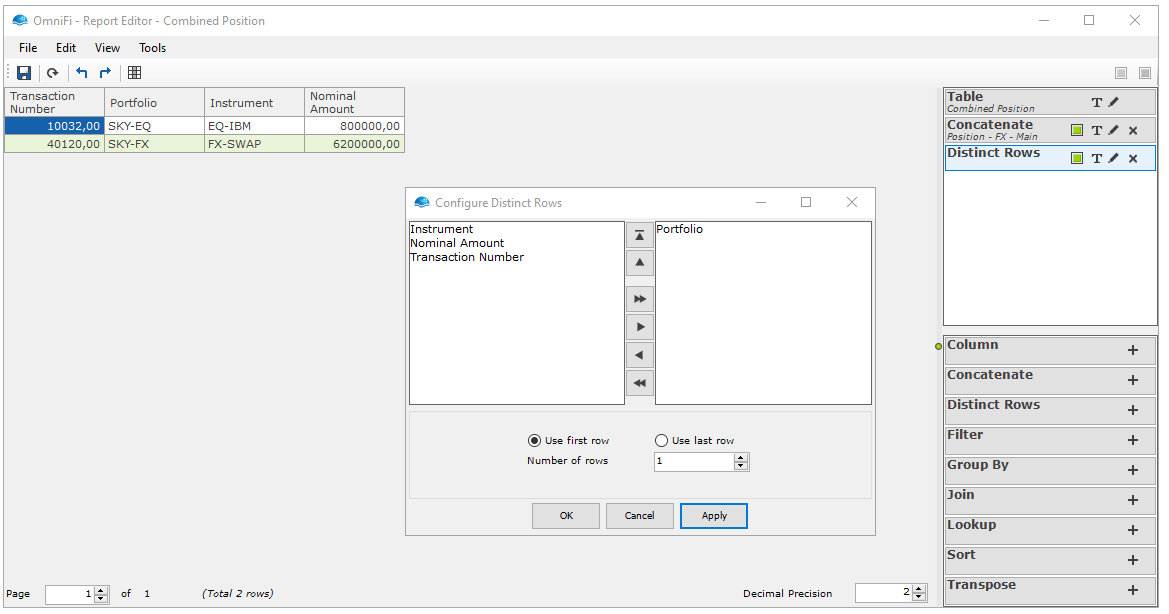
Dataset with duplicate entries
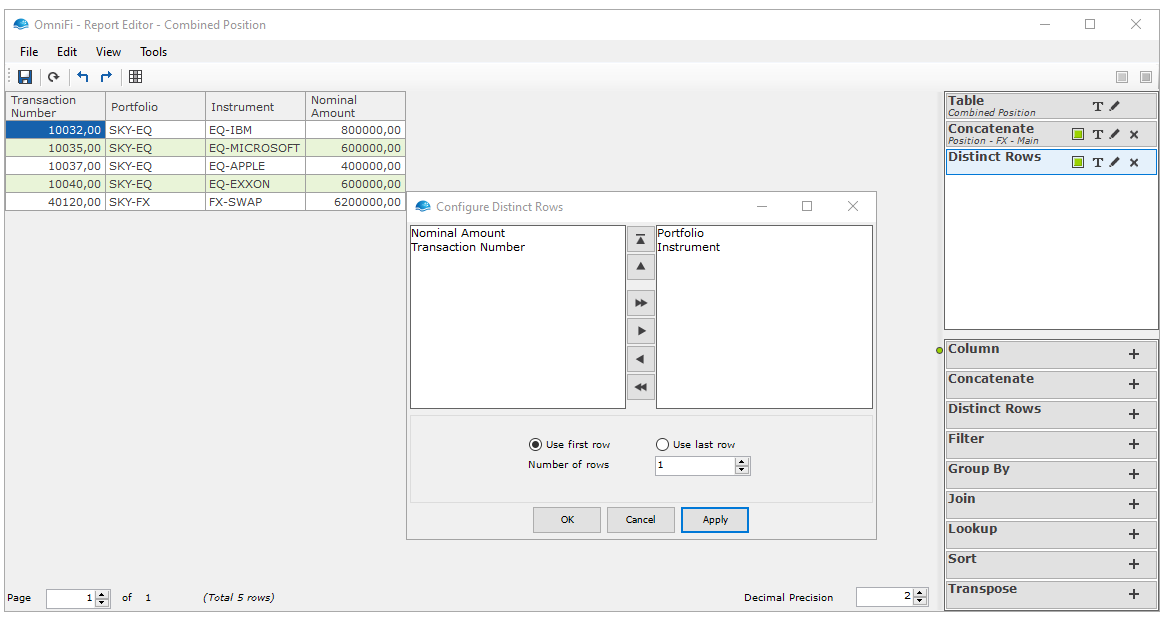
Dataset after applying Distinct Rows modifier
There are two additional options for the modifier in the Configure Distinct Rows window:
- Use first/last row switches allow you to choose whether to use first or last distinct row. The figures below illustrates how the modifier behaves in the two different options:
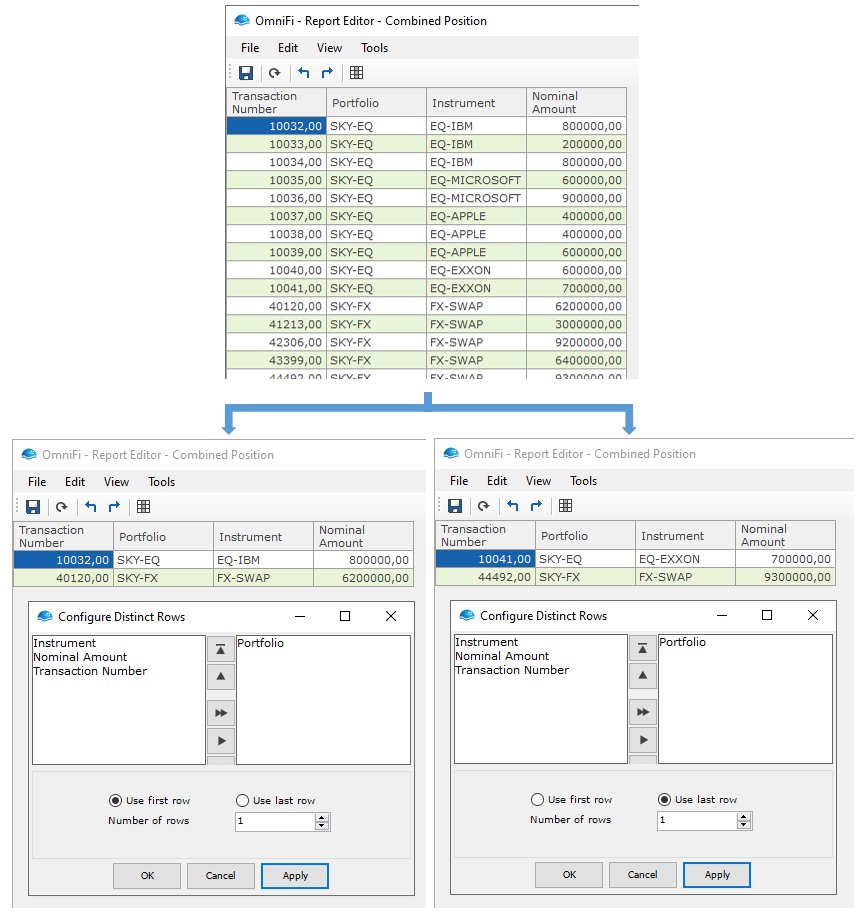
- Number of rows indicates how many number of distinct rows to show. The default value is 1. The number of rows will be counter from the first or last row depending on which is chosen.
You can also skip choosing a column, and have Distinct Rows simply return the first or last N rows from the set.
Filter
The Filter modifier is used to filter through specific data that matches certain conditions.
Filter Conditions
Filter conditions are defined in the Configure Filter window by selecting which column to filter, what operator to apply, and what value to use from the corresponding dropdown lists. The dropdown list for values to use depends on which column has been chosen. For example, if you select "Instrument", then a list of available instruments from the report will be shown.
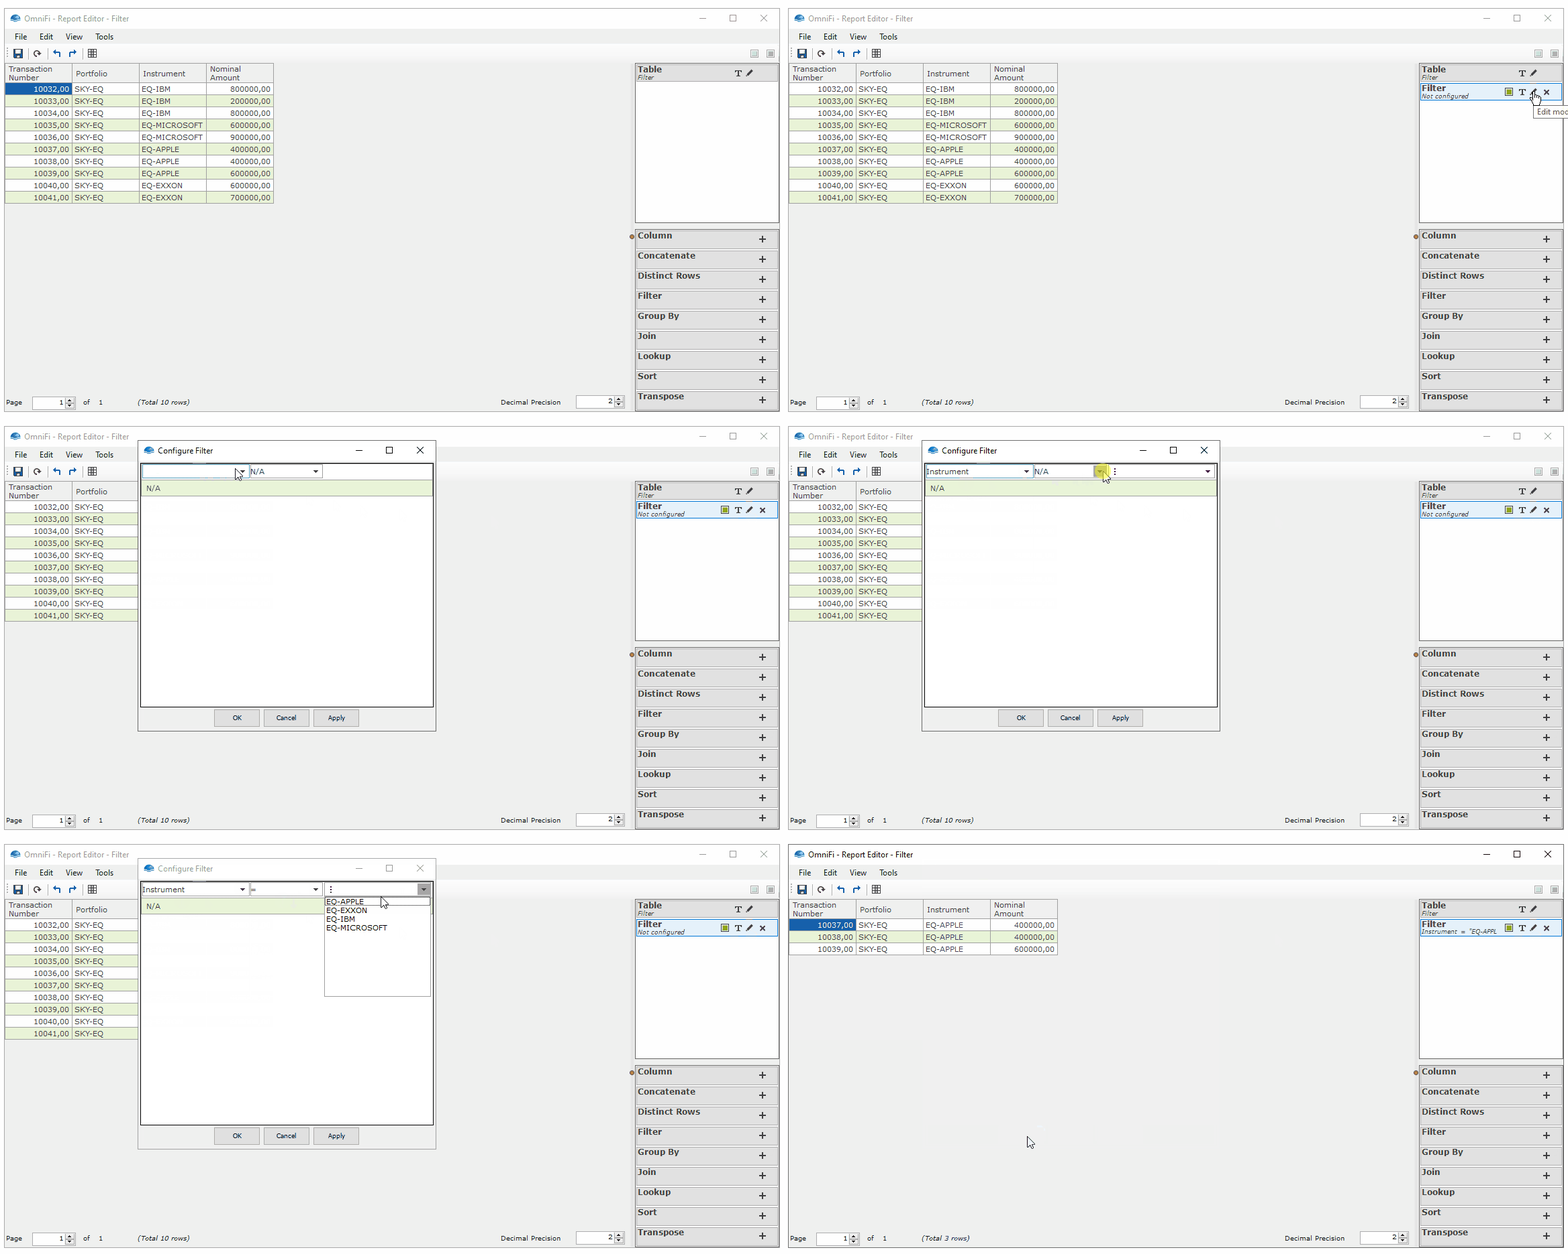
Sample of Filter Modifier
Almost all columns will have dropdown list of values from which to choose. The two exceptions are:
- Boolean
- To use true value, write "True" or "Yes".
- To use false value, write "False" or "No".
- Number If a column contains a number, such as Nominal Amount, the value must be typed in the box. The format should follow the local number format set in the Regional and Language Options.
The table below lists the available operators and explains how to use "Regexp" and "NotRegexp".
| Value | Expression | Comment |
|---|---|---|
| = | Equal To | |
| <> | Not equal to | |
| > | Larger than | |
| >= | Larger than or equal to | |
| < | Less than | |
| <= | Less than or equal to | |
| Regexp | Regular expression | Use these two operators for strings only. |
And/Or Conditions
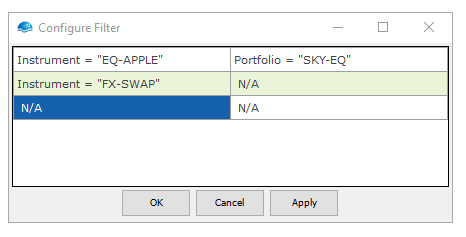
Several rows and columns may be used to configure filter conditions. Expressions in the same row are combined with an "AND" logic, while expressions in different rows are combined with "OR". Another way to implement "AND" conditions is by adding several Filter modifier to the modifier stack.
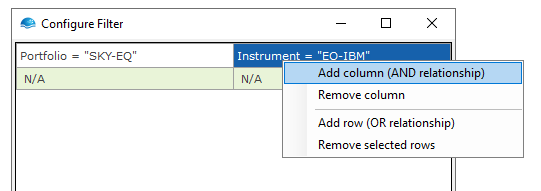
In the figure below, the condition means display (Portfolio = SKY-EQ AND Instrument = EQ-APPLE) OR (Instrument = FX-SWAP).
Adding and Removing Conditions
To add or remove rows and columns, right-click on a row and select from the given options.
Group By
The Group By modifier is used to create horizontal and vertical groupings in the report.
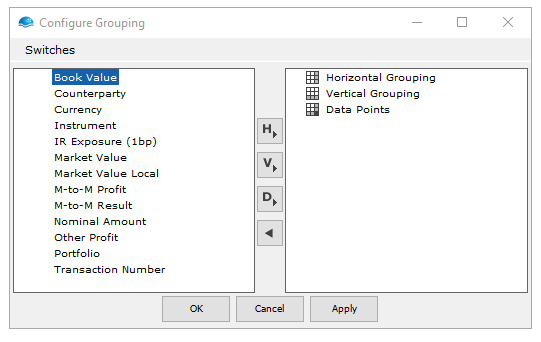
The groupings are configured in the Configure Grouping window where column names are listed on the left while grouping sets are listed on the right. You can drag and drop the column names from the list into the sets on the right. Data under Data Points will be grouped horizontally by the fields in Horizontal Grouping and grouped vertically by the fields in Vertical Grouping.
Switches
At the top left corner of the configuration window are Switches that give additional options for the grouping:
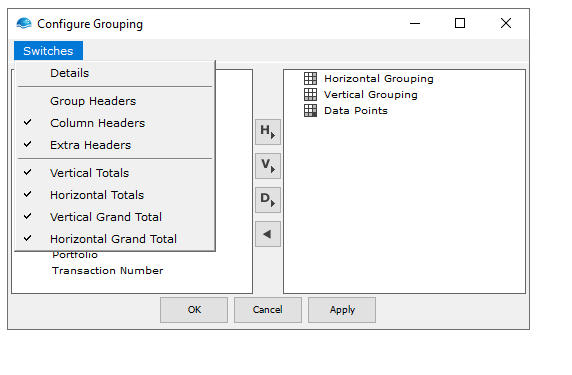
- Details allows you to choose whether to include drill-down information in the report.
- Group Headers displays a header for each vertical grouping on an extra row.
- Column Headers displays column headers in the table.
- Extra Headers for each column displays an extra header line per horizontal grouping level to indicate what group the column belongs to at that level
- Vertical Totals displays totals for the vertical groupings.
- Horizontal Totals displays totals for the horizontal groupings.
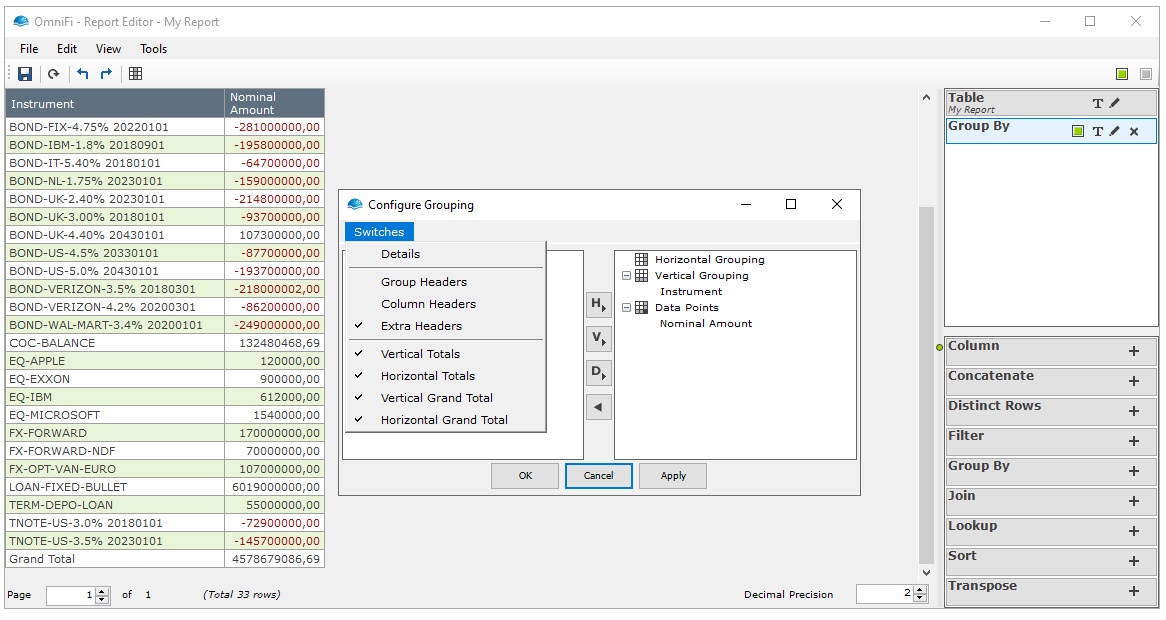
Example 1: Vertical Grouping by Instrument
Below is an example of a vertical grouping by Instrument. The report shows the total nominal amount for each instrument as well as the grand total nominal amount at the bottom.
Example 2: Vertical Grouping by Counterparty and Instrument
Below is an example of a vertical grouping by counterparty and instrument. The report shows the nominal amount for each instrument (as in Example 1), but further subdivided into counterparties.
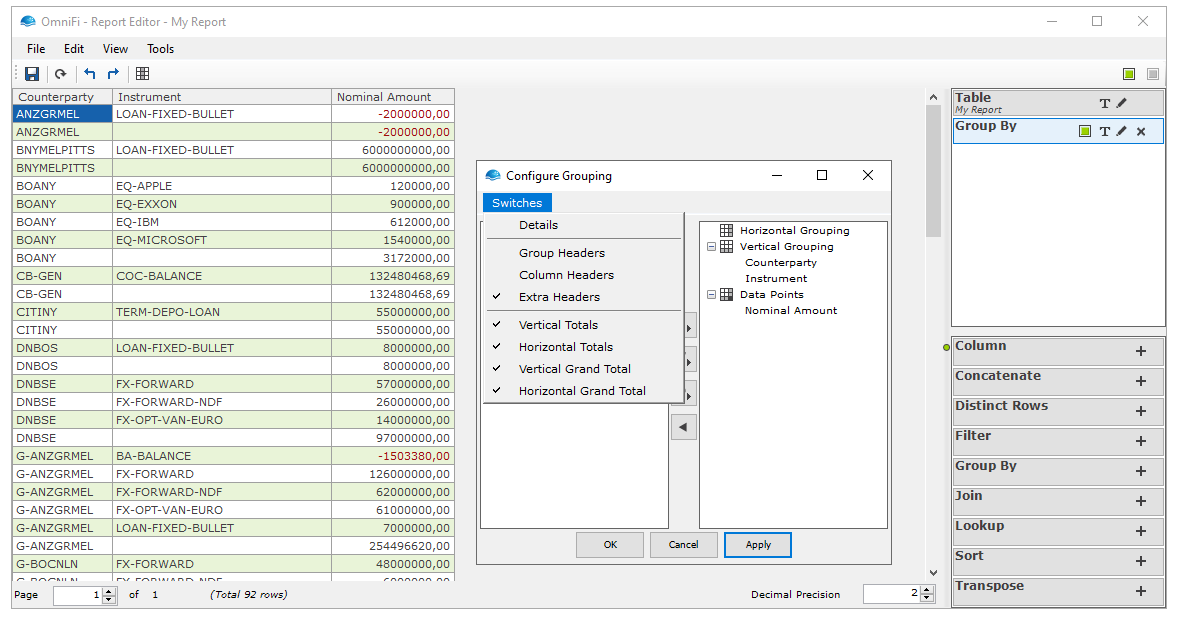
The Group By modifier aggregates data and sums it up. It is however possible to combine multiple modifiers in a sequence to calculate Average, Count and similar operations.
Join
The Join modifier is used to combine two datasets by adding the columns of the join data to those of the base data.
Consider a case where one dataset (or query) contains details about a position, including an Issuer ID. The user might need additional details about the Issuer, such as it's full Name of the Issuer, the country of the issuer or similar; information that's not available in the initial dataset.
The solution would be to create a separate query to extract the additional issuer details and then join the two.
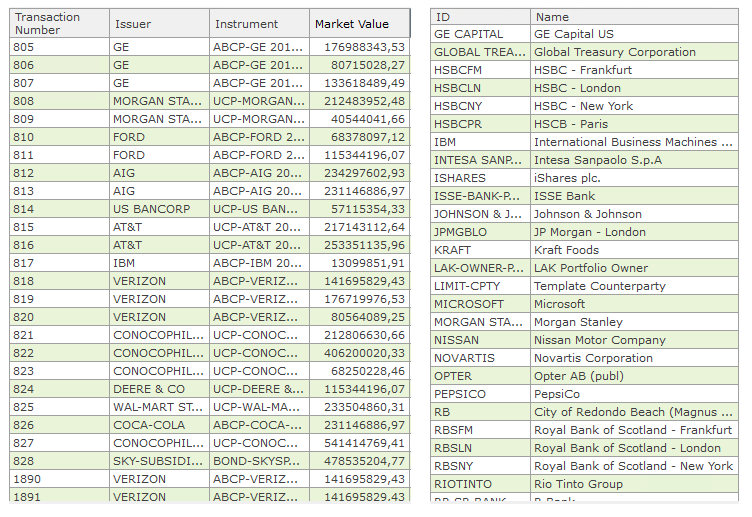
Example of two datasets to be joined
To configure the modifier, the steps:
- Add modifier to the Modifier Stack
- Selecting the data to join through the Select dataset window. You can either choose to create a new query by selecting
<Create New Query ..>, or choose an existing dataset from a saved query or another report. - Define the key column between the two datasets by selecting a column from either side and pressing the
+button - Select which columns to include (or exclude) from the join by using the toggle switches next to the second dataset
- Press OK to finalize the process. Optionally you can afterwards rename the newly added column as you desire.
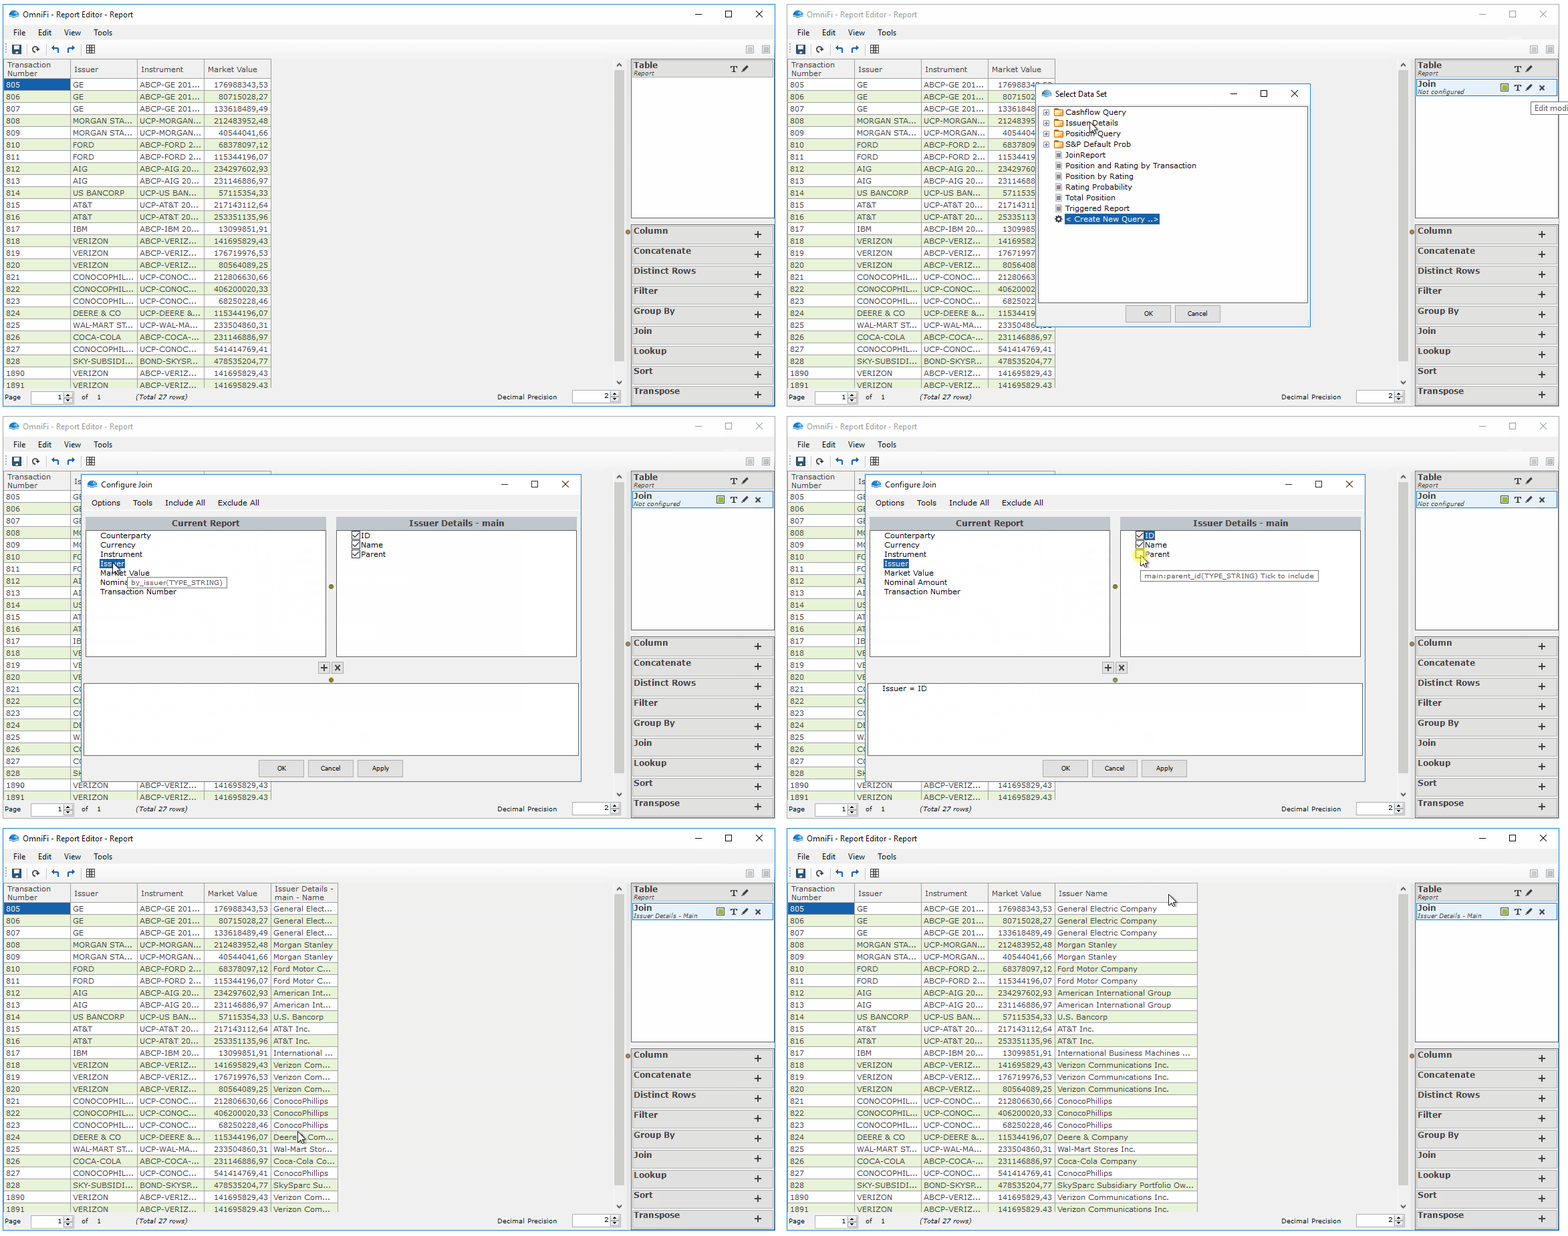
Sample of Join Modifier process
Columns to Include
Notice that there are check boxes to the right of the columns names for the join data. These boxes are used to choose which columns to include in the Join. All columns are ticked by default.
Options and Tools
At the top left corner of the configuration window are Options and Tools that give additional configuration options for the join.
Under Options, we have the following:
- Include all rows includes all rows in the report, regardless of whether they have any corresponding rows in the join dataset. If unchecked, rows without any corresponding rows in the join dataset will be excluded.
- Allow Empty Keys activate to join records where parts of the key is empty.
- Add Header Prefix adds a prefix "Dataset name - " to the column headers of the join dataset. If unchecked, the columns will only have their regular headers. This is particularly useful to ensure that no columns have the same names when joining data with similar names, and also when using several join modifiers to see which column came from which dataset.
- Include new columns allows to to define that any new columns appearing in the lookup dataset should automatically be included in the report (toggle set to true). The default value is that new columns are not included.
Under Tools, there is Select Dataset that allows you to change what dataset to join.
If a row in the base dataset has several corresponding rows in the join dataset, the row is duplicated.If a row in the base dataset has no corresponding rows in the join dataset, the row will be excluded unless the Include All Rows option is checked.
Lookup
The Lookup modifier is used to look up data in a dataset and join it with the report. It is based on the VLOOKUP function in Excel with convenient extensions.
In its simplest form, the Lookup modifier can perform the same operations as the Join can. The lookup modifier however has additional capabilities where the criteria for the merge can be more flexible.
Consider a case where we have two datasets, one dataset that contains position information, and a second dataset that includes rating information for the issuers. A report where the two datasets are merged is desired. The complexity of the merge is that we have multiple rating codes for each issuer, as they are rated by different agencies and ratings also change over time.
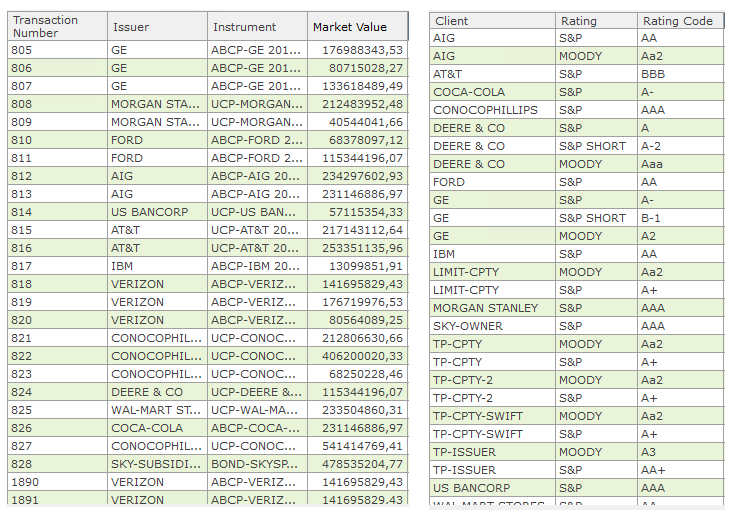
Datasets to join
To configure the modifier, the steps:
- Add modifier to the Modifier Stack
- Selecting the data to join through the Select dataset window. You can either choose to create a new query by selecting
<Create New Query ..>, or choose an existing dataset from a saved query or another report. - Define the key column between the two datasets by selecting a column from the dataset to be joined and link it to a column in the base data set.
- Add additional keys or criteria (only rows that equal S&P in the below example)
- Select which columns to include (or exclude) from the join by using the toggle switches next to the second dataset
- Press OK to finalize the process. Optionally you can afterwards rename the newly added column as you desire.
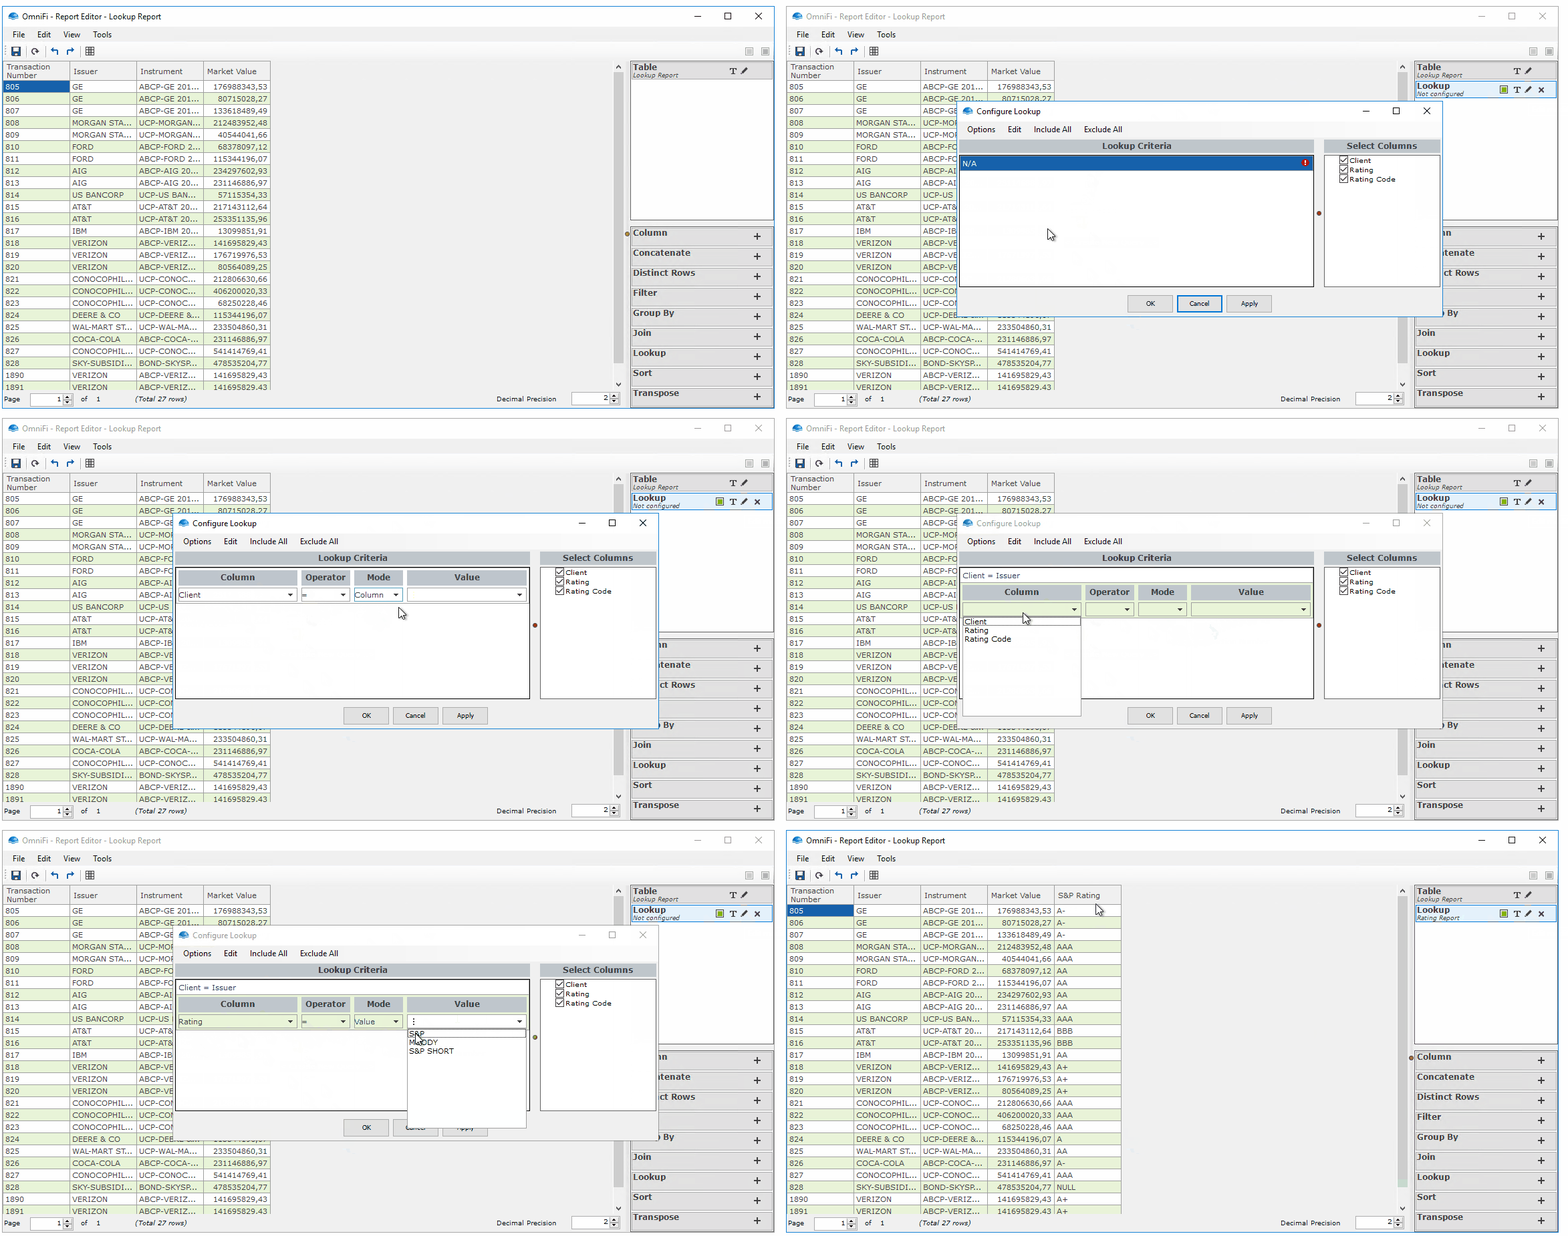
Sample of Lookup Modifier
Lookup Criteria
After selecting which dataset to lookup, the Configure Lookup window is launched where you can configure the lookup criteria:
- Column is the column name in the lookup data.
- Operator is the operator to apply.
- Mode is either Column or Value. Colum lets you compare the lookup Column to a column in the base dataset. Value lets you compare the lookup Column to a static value or to a reference in Excel.
- Value is the value to which Column is compared. This can either be a fixed value, a reference to an Excel cell, or a column in the report, depending on what Mode is set.
Each of these can be chosen simply by selecting from their corresponding dropdown lists.
Columns to Include
On the right of the Configure Lookup window is a list of the available columns from the lookup dataset where you can choose which columns to include in the output simply by ticking and unticking the boxes next to the column name.
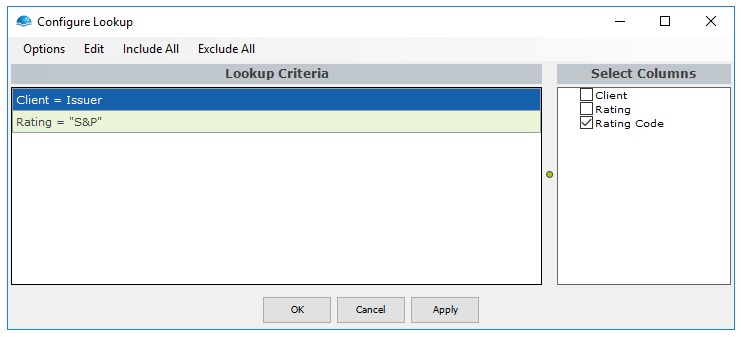
Choose columns to select in the right panel
Options and Edit
At the top left corner of the configuration window are Options and Edit that give additional configuration options for the lookup.
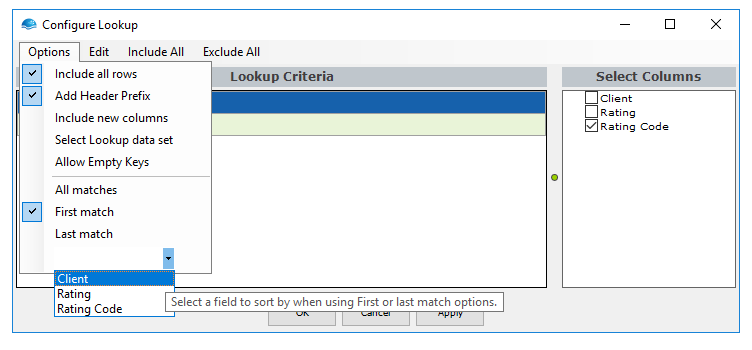
Additional options when configuring the Lookup modifier
Under Options, we have the following:
- Include all rows includes all rows in the report, regardless of whether they have any corresponding rows in the lookup dataset. If unchecked, rows without any corresponding rows in the lookup dataset will be excluded.
- Add Header Prefix adds a prefix "Dataset name - " to the column headers of the join dataset. If unchecked, the columns will only have their regular headers. This is particularly useful to ensure that no columns have the same names when joining data with similar names, and also when using several join modifiers to see which column came from which dataset.
- Include new columns allows to to define that any new columns appearing in the lookup dataset should automatically be included in the report (toggle set to true). The default value is that new columns are not included.
- Select Lookup dataset allows you to change what dataset to lookup.
- Allow Empty Keys activate to join records where parts of the key is empty.
- Sorting and Matching allows you to choose whether to include all rows that match the criteria (All matches), only the first rows that match the criteria (First match), or only the last rows that match the criteria (Last match). When choosing First or Last match, you can also choose the column by which to sort the data in order to determine what the first and last rows will be.
Under Edit, there is Add/Remove condition that allows you to add or remove conditions to/from the lookup criteria.
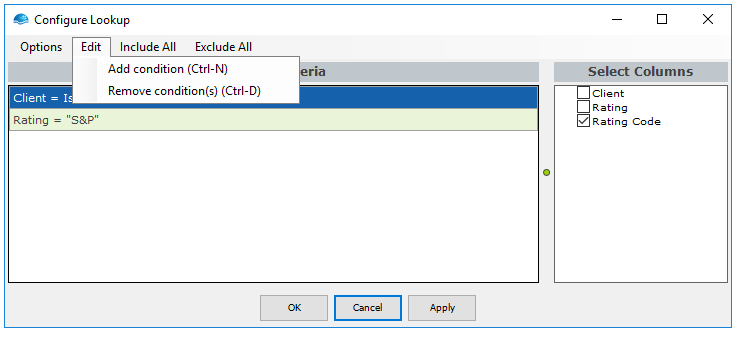
Sort
The Sort modifier is used to sort the data using a set of columns.
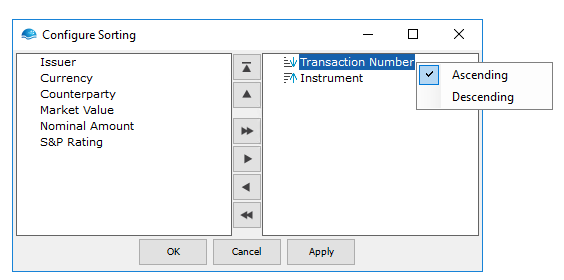
In the Configure Sorting window, you can select which column/s to use for the sorting. The order of the columns is important as it determines which columns to sort first. In the example below, the data will be sorted first by "Transaction Number", then by "Instrument". Right clicking on a sorting column allows you to choose whether to sort ascending or descending.
Transpose
The Transpose modifier is used to transpose a dataset by switching the x- and y-axis; rows become columns and columns become rows. As opposed to rotating the set, transposing will "flip" the data along the diagonal, retaining the relative row or column position in the dimension; the first row becomes the first column and the first column becomes the first row. The top left and bottom right corners stay in place.
To illustrate, consider the simple dataset shown in the figure below.
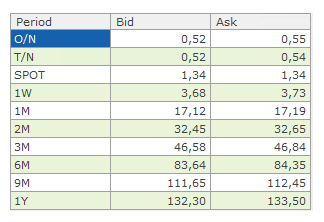
Sample dataset to transpose
Adding the transpose modifier to the stack will immediately transpose the given data using the standard configuration. However, the behavior of the modifier may be configured through the Configure Transpose window.
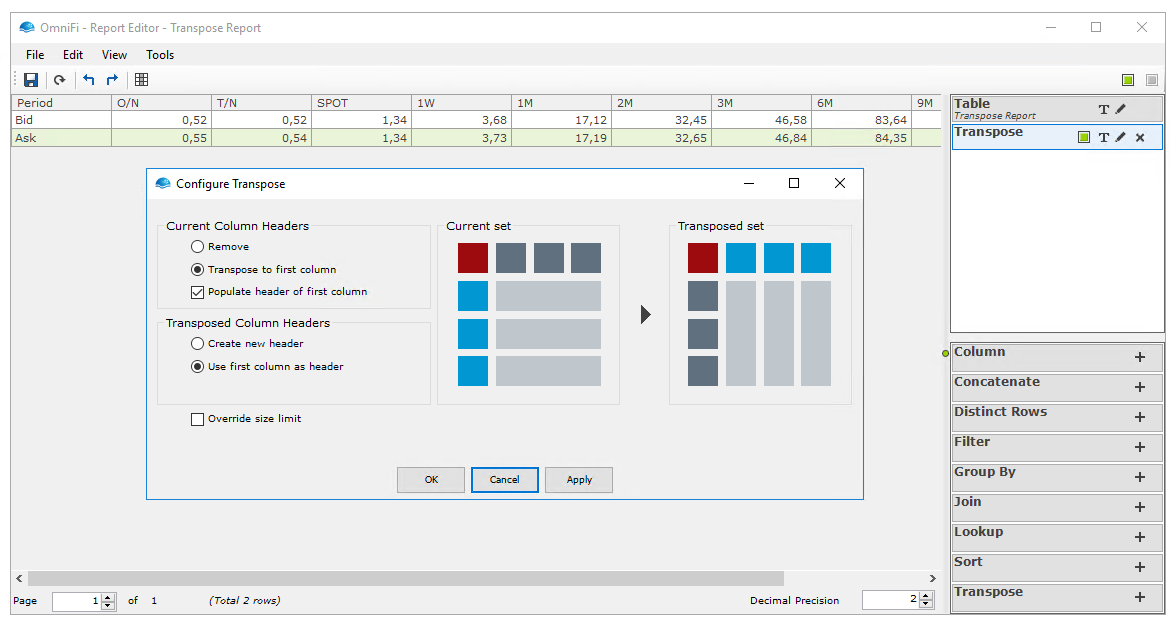
Dataset after transposed
-
Current Column Headers section contains the configurations for the column headers in the original dataset:
-
Remove removes the column headers of the original dataset.
-
Transpose to first column transposes the column headers of the original dataset to be the first column of the transposed dataset.
-
Populate header of first column populates the header of the first column of the transposed dataset. This option is only available when the Transpose to first column option is chosen.
The Transposed Column Headers section contains the configurations for the column headers in the transposed dataset:
- Create new header creates new column headers.
- User first column as header uses the first column of the original dataset as the column headers of the transposed dataset.
The Current and Transposed Sets provide a schematic view of the transpose operation by showing the structure of the original dataset compared to that of the transposed dataset, given the options chosen. In the example below, the same original dataset is used as above, but with the option to create new header. This new header is represented by the darker blue squares in the image below.
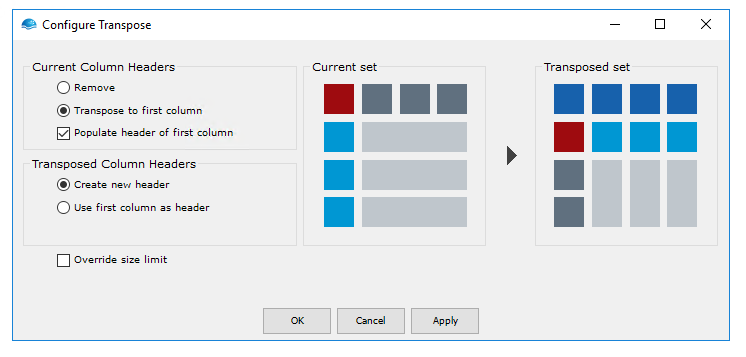
Configuration options for Transpose modifier
The resulting report is shown below, with the auto-generated headers being alphabetical letters.

Resulting output after adding new header
Override Size Limit
The Transpose modifier is limited to a maximum of 300 rows, giving a maximum of 300 columns after the data is transposed. The limit is in place to mitigate the fact that handling more than 300 columns is quite impractical.
It is possible to override this limit by checking the Override size limit option. When doing so, however, please still ensure that the size of the original dataset is minimized as much as possible to avoid having very large number of columns. A Distinct modifier, for example, can be used to limit the maximum number of incoming rows to be transposed.
Types of Transposed Datasets
OmniFi reports handle multiple types of data from text to numbers to dates. Because it is difficult to work on data where multiple types are represented in the same column, data types must be uniform per column in the transposed output. Since a column in a transposed dataset is a row in the original dataset, in principle all data in the transposed set must be of the same type.
The Transpose modifier automatically converts all data to the same, most specific type that can represent all data points in the original dataset. This is done according to the diagram below that shows how different data types relate in terms of convertibility. Data types are more specific closer to the bottom.
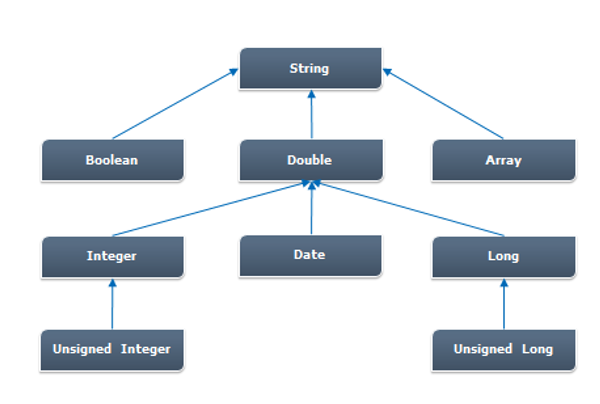
As all rows in the original dataset have the exact same types (same combination of columns), Transpose will calculate the most specific type that can represent all values on one row according to the scheme above.
The most general data type is String (text), which can represent any data visually. A rational number (integer) is more specific than a real number (double), because it can only represent a small fraction of real numbers (those with a decimal value of 0).
There are exceptions:
- If the first column in the original set is used as column headers in the transposed set, it is omitted from the calculation.
- If the column header from the original set is transposed to the first column, the first column is always String, as the header is always string.
Updated 9 months ago